

Global GDP could be boosted across some of the world’s biggest economies by $2trn by raising employment rates for the over 55s to match Swedish levels — the highest performing European Union country.
PwC’s Golden Age Index — a weighted average of employment, earnings and training across the world’s OECD countries — has found potential gains could rise as high as 16 percent of GDP for Greece and 13 percent for Belgium.
Go deeper with GlobalData

For the US, they could be around three percent of GDP, or around two percent of GDP for Japan.
Iceland, New Zealand, Israel and Sweden lead the way — scroll down for the full OECD ranking
Iceland remains number one in the index, a position it has held since 2003.
Nordic neighbours Sweden and Norway also continue to do well with places in the top 10. Turkey maintains its position at the bottom of the index, having fallen 12 places since 2003.
Israel has gained 10 places in the rankings since 2003, up from 13th place to 3rd, while Mexico has fallen from 6th place in 2003 to 18th place today.
How well do you really know your competitors?
Access the most comprehensive Company Profiles on the market, powered by GlobalData. Save hours of research. Gain competitive edge.

Thank you!
Your download email will arrive shortly
Not ready to buy yet? Download a free sample
We are confident about the unique quality of our Company Profiles. However, we want you to make the most beneficial decision for your business, so we offer a free sample that you can download by submitting the below form
By GlobalDataCarol Stubbings, global people and organisation leader at PwC, said:
For employers, flexible working and partial retirement options can pay dividends, as can redesign of the workplace to meet the needs of older workers. Flexible working policies can incentivise women to remain in work longer, so having the right policies in place will increase the employment rate of those over 55 and may help to reduce the gender pay gap which is shown to increase with age.
PwC has found a higher educational background is also associated with working later into old age.
More qualified older workers may be better able to adapt to technological changes, while the industries in which more qualified workers are employed could be better suited to working in later life.
How does the UK fare?
The UK has remained middling in the rankings since 2003, falling by one place from 18th in 2014 from 19th in 2015.
PwC estimates the UK could boost its GDP by around 4.2 percent (around £80bn) if the employment rate of workers aged over 55 could match that of Sweden.
There is a 12 percentage point gap between the employment rates of workers aged 55-64 in the UK and Sweden.
Across the UK older female workers have a lower employment rate than their male counterparts at 64.9 percent for 50-64 year-olds compared to 75.4 percent for males.
The gender pay gap also increases with age, from an average of £28 per week for 22-29 year-olds to £153 for 50-59 year-olds.
PwC analysis suggests the labour market experience of older women is often characterised by lower pay, more part-time work and higher barriers to entry than males, driven by work-life patterns and occupational segregation.
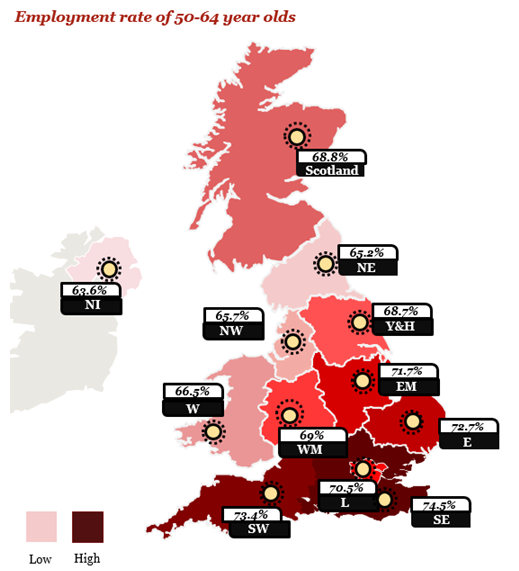
Across the UK, the South East of England has the highest employment rate of older workers aged 50-65 at 74.5 percent, compared to a UK average of 70 percent.
Northern Ireland has the lowest employment rate for older workers at 63.6 percent, compared to 66.5 percent for Wales, 68.8 percent for Scotland and 70.6 percent for England.
PwC has found regional differences in employment rates of older UK workers appear to hinge on three key factors: economic performance, educational attainment and gender disparities.
John Hawksworth, PwC’s chief economist, said:
“While the UK’s absolute performance on our Golden Age Index has improved over time, it’s still scoring below the OECD average.
“As the number of people over 55 continues to grow steadily and life expectancy increases, the UK needs to make it as easy as possible for people to continue working for longer if they wish to do so.
“This would boost both GDP and tax revenues, so helping to pay for the increased health, social care and pension costs of an ageing population.
“Looking at employment rates for older workers across the UK reveals the areas that need the most focus, as well as symptoms of poor performance.
“Regions with fewer older workers with university degrees and a larger gap between male and female employment tend to have the lowest employment rates for older workers.”
The full PwC Golden Age Index of the world’s OECD countries
| Rank | Country | Index | ||||||
| 2003 | 2007 | 2014 | 2015 | 2003 | 2007 | 2014 | 2015 | |
| 1 | 1 | 1 | 1 | Iceland | 92.5 | 93.1 | 97.2 | 98.8 |
| 9 | 3 | 2 | 2 | New Zealand | 60.9 | 71.5 | 82.4 | 84.2 |
| 13 | 10 | 3 | 3 | Israel | 58.2 | 65.7 | 78.3 | 80.1 |
| 3 | 4 | 4 | 4 | Sweden | 68.1 | 71.2 | 78.2 | 79.6 |
| 8 | 2 | 5 | 5 | Estonia | 63.4 | 73.6 | 76.5 | 78.6 |
| 4 | 8 | 6 | 6 | Norway | 67.4 | 69.7 | 76.3 | 77.5 |
| 7 | 6 | 9 | 7 | Korea | 64.1 | 70.7 | 72.4 | 76.8 |
| 5 | 7 | 10 | 8 | Japan | 66.8 | 70.3 | 70.7 | 75.8 |
| 2 | 5 | 7 | 9 | United States | 68.7 | 70.7 | 74.8 | 74.6 |
| 14 | 11 | 8 | 10 | Chile | 57.3 | 65.7 | 74.2 | 71.8 |
| 10 | 13 | 11 | 11 | Switzerland | 60.7 | 62.7 | 67.9 | 70.8 |
| 20 | 17 | 16 | 12 | Australia | 45.7 | 54.8 | 62.9 | 69.3 |
| 11 | 14 | 12 | 13 | Denmark | 59.7 | 59.5 | 64.7 | 67.7 |
| 16 | 15 | 14 | 14 | Finland | 51.1 | 58.4 | 64.1 | 66.2 |
| 25 | 20 | 17 | 15 | Germany | 37.1 | 47.6 | 62.5 | 66.0 |
| 15 | 16 | 15 | 16 | Canada | 53.5 | 58.0 | 63.8 | 65.3 |
| 12 | 9 | 19 | 17 | Portugal | 59.3 | 66.6 | 55.3 | 62.5 |
| 6 | 12 | 13 | 18 | Mexico | 64.4 | 65.4 | 64.5 | 62.3 |
| 17 | 19 | 18 | 19 | United Kingdom | 47.7 | 51.0 | 58.4 | 61.2 |
| 18 | 18 | 23 | 20 | Ireland | 47.3 | 54.6 | 52.3 | 60.1 |
| 21 | 22 | 20 | 21 | Czech Republic | 43.5 | 45.8 | 54.5 | 59.1 |
| 27 | 26 | 21 | 22 | Netherlands | 34.8 | 42.6 | 53.7 | 56.4 |
| 30 | 25 | 24 | 23 | Austria | 32.5 | 43.3 | 51.2 | 54.8 |
| 23 | 24 | 22 | 24 | France | 42.8 | 44.9 | 52.4 | 53.2 |
| 24 | 21 | 25 | 25 | Spain | 42.6 | 46.5 | 49.9 | 52.5 |
| 29 | 30 | 27 | 26 | Hungary | 32.5 | 36.2 | 46.9 | 51.3 |
| 28 | 28 | 26 | 27 | Italy | 33.1 | 36.8 | 46.9 | 49.7 |
| 32 | 32 | 28 | 28 | Slovak Republic | 30.0 | 35.5 | 46.6 | 48.6 |
| 26 | 34 | 30 | 29 | Poland | 35.7 | 32.4 | 44.7 | 48.0 |
| 34 | 29 | 29 | 30 | Belgium | 29.0 | 36.7 | 45.4 | 47.7 |
| 19 | 23 | 32 | 31 | Greece | 46.2 | 45.2 | 42.0 | 46.4 |
| 33 | 27 | 33 | 32 | Slovenia | 29.7 | 37.4 | 41.9 | 44.7 |
| 31 | 31 | 31 | 33 | Luxembourg | 30.3 | 35.5 | 43.2 | 41.3 |
| 22 | 33 | 34 | 34 | Turkey | 43.5 | 34.2 | 37.8 | 36.8 |
| OECD Average | 50.0 | 54.5 | 60.4 | 62.9 | ||||