
The technology industry continues to be a hotbed of innovation, with activity driven by the amalgamation of technological progress, heightened connectivity, and the urgency for businesses to enhance efficiency and competitiveness in an ever-changing marketplace, and growing importance of technologies such as data collection and integration, big data processing, natural language processing, and visualisation and reporting. These technologies work in tandem to collect, process, analyse, and interpret behavioural data, providing insights into user behaviour, preferences, and trends. In the last three years alone, there have been over 3.6 million patents filed and granted in the technology industry, according to GlobalData’s report on Innovation in Artificial Intelligence: Behavioral analytics. Buy the report here.
Smarter leaders trust GlobalData

However, not all innovations are equal and nor do they follow a constant upward trend. Instead, their evolution takes the form of an S-shaped curve that reflects their typical lifecycle from early emergence to accelerating adoption, before finally stabilising and reaching maturity.
Identifying where a particular innovation is on this journey, especially those that are in the emerging and accelerating stages, is essential for understanding their current level of adoption and the likely future trajectory and impact they will have.
300+ innovations will shape the technology industry
According to GlobalData’s Technology Foresights, which plots the S-curve for the technology industry using innovation intensity models built on over 2.5 million patents, there are 300+ innovation areas that will shape the future of the industry.
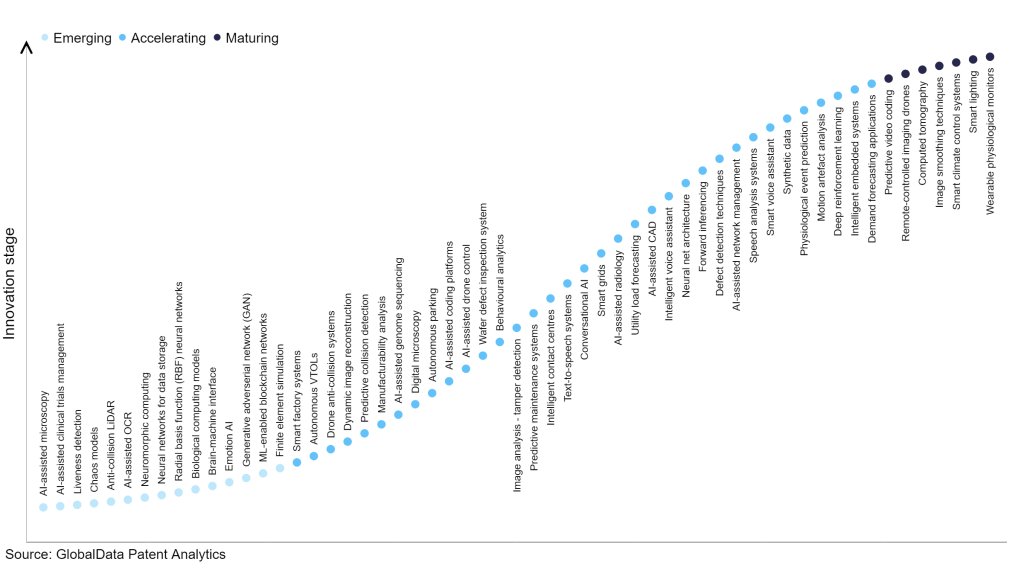
Within the emerging innovation stage, finite element simulation, ML-enabled blockchain networks, and generative adversarial network (GAN) are disruptive technologies that are in the early stages of application and should be tracked closely. Demand forecasting applications, intelligent embedded systems, and deep reinforcement learning are some of the accelerating innovation areas, where adoption has been steadily increasing. Among maturing innovation areas, wearable physiological monitors, smart lighting, and smart climate control systems, are now well established in the industry.
Innovation S-curve for artificial Intelligence in the technology industry
Behavioural analytics is a key innovation area in artificial Intelligence
Behavioural analytics involves gathering, examining, and interpreting data on user behaviour to recognise and comprehend patterns and tendencies. Its primary objectives are to enhance user experiences on websites and applications, refine marketing strategies, evaluate customer loyalty, assess product performance, and measure the effectiveness of customer service. By scrutinising user behaviour data, organisations gain valuable insights that aid in improving various aspects of their operations.
GlobalData’s analysis also uncovers the companies at the forefront of each innovation area and assesses the potential reach and impact of their patenting activity across different applications and geographies. According to GlobalData, there are 900+ companies, spanning technology vendors, established technology companies, and up-and-coming start-ups engaged in the development and application of behavioural analytics.
Key players in behavioral analytics – a disruptive innovation in the technology industry
‘Application diversity’ measures the number of different applications identified for each relevant patent and broadly splits companies into either ‘niche’ or ‘diversified’ innovators.
‘Geographic reach’ refers to the number of different countries each relevant patent is registered in and reflects the breadth of geographic application intended, ranging from ‘global’ to ‘local’.
Patent volumes related to behavioural analytics
Source: GlobalData Patent Analytics
Microsoft is one of the leading patent filers in behavioural analytics. The company’s patents are aimed at an example where a granularity of company similarity is determined, wherein the granularity of company similarity is a level at which social networking data should be filtered.
A weighted graph of companies is constructed at the granularity of company similarity, wherein each node in the weighted graph is a company and a directed edge exists in the weighted graph between a first node and a second node of the social networking data, at the granularity of company similarity, indicating that a transition occurred wherein a member who held a position at a company corresponding to the first node transitioned to a position at a company corresponding to the second node, wherein each directed edge contains a weight indicating a strength of relationship between nodes. The weighted graph of locations is traversed from a node corresponding to the target company to identify companies similar to the target company.
Other prominent patent filers in the space include Alphabet and International Business Machines (IBM).
In terms of geographic reach, Macerich leads the pack, followed by Mastercard Technologies Canada and ATSR. In terms of application diversity, Align Technology holds the top position, followed by Novoluto and Shanghai Cambricon Information Technology.
Behavioural analytics is significant in driving personalisation, optimising conversions, enhancing customer retention, guiding UX/UI design, optimising marketing activities, informing product development, and improving customer service experiences. It empowers organisations to make data-driven decisions and deliver tailored experiences that meet customer expectations, resulting in improved business outcomes. To further understand how artificial Intelligence is disrupting the technology industry, access GlobalData’s latest thematic research report on Artificial Intelligence (AI) – Thematic Intelligence.
Premium Insights
From
![]()
The gold standard of business intelligence.
Blending expert knowledge with cutting-edge technology, GlobalData’s unrivalled proprietary data will enable you to decode what’s happening in your market. You can make better informed decisions and gain a future-proof advantage over your competitors.
GlobalData, the leading provider of industry intelligence, provided the underlying data, research, and analysis used to produce this article.
GlobalData’s Patent Analytics tracks patent filings and grants from official offices around the world. Textual analysis and official patent classifications are used to group patents into key thematic areas and link them to specific companies across the world’s largest industries.