
A caveat is needed for interpreting the data responsibly. GlobalData does not—and cannot—track every IoT deployment worldwide; only a small portion of deployments are publicly disclosed. The tracker should therefore be used as a consistent, longitudinal sample of publicly described deployments, but not as a measure of the total market. Likewise, the data should not be used as a proxy for devices, connections, or revenue: IoT deployments range from small trials to national rollouts, and “one deployment” can represent anything from a few devices to millions. Even with these limitations, a ten-year view based on more than 10,000 deployments provides a useful view of where new deployment activity is showing up and how priorities are changing.
Seen through that lens, the contrast between the late 2010s and the early-to-mid 2020s is striking. The 2016–2020 period reflects what might be called IoT’s “visibility era.” Many deployments are centred on getting data out of the physical world—adding sensors and telemetry to assets, tracking location, monitoring conditions, and pushing readings into dashboards. This phase was important: organisations needed to prove that devices could be connected securely and that operational teams could use the resulting data. But it also resulted in a pattern of IoT initiatives that delivered large sets of operating data, only sometimes with derived insight, and not always integrated into day-to-day processes.
Go deeper with GlobalData


Access deeper industry intelligence
Experience unmatched clarity with a single platform that combines unique data, AI, and human expertise.
By contrast, 2021–2025 looks more like an “operations era,” in which deployments are more often designed to automate decisions and actions rather than simply report conditions. In practical terms, IoT is showing up less as a standalone monitoring layer and more as part of operating processes—often paired with analytics and AI—so that data collection is the beginning of the value chain, not the end.
This shift shows up first in who is deploying. In 2016–2020, manufacturing and government were tied as the leading verticals in the tracker, each representing 19% of deployments. In 2021–2025, the government increases to 22% while manufacturing drops to 14%. The takeaway is not that manufacturing “stopped doing IoT,” but that other sectors—particularly those tied to public infrastructure and large-scale service delivery—accelerated faster in the early 2020s. Utilities also gain share, rising from 8% to 10%, while construction and engineering move from 4% to 6% and business services grow from 6% to 8%. Together, these shifts point to IoT being applied more broadly across the built environment: infrastructure, facilities, campuses, and field operations. Some verticals decline in share—retail falls from 6% to 4% and agriculture from 5% to 2%—but, given the tracker’s nature, the most meaningful signal is where new publicly tracked activity is concentrating, not an absolute verdict on market size.
The use-case mix reinforces the move from “measure and locate” to “operate and automate.” In 2016–2020, the tracker is dominated by categories associated with visibility: advanced automation (14%), telematics (14%), condition monitoring (13%), and asset tracking (13%). By 2021–2025, advanced automation becomes the clear standout at 21%, and telematics grows to 17%, while condition monitoring drops sharply to 7% and asset tracking falls to 8%. Environmental monitoring declines to 5%, and people and animal tracking fall to 4%. This does not mean organisations no longer care about monitoring temperature, vibration, or location—those are foundational capabilities. Rather, it suggests that a growing share of new deployments are designed to act on those data points as part of operations, not just collect them.
Smart city and smart building deployments also expand, consistent with IoT being embedded into ongoing service delivery. Smart city initiatives rise from 11% to 15%, and smart buildings increase from 8% to 10%. These are often multi-stakeholder, multi-asset programs, where the “solution” is less a device layer than an operating model for a place—supported by connected infrastructure.
Connectivity choices are shifting in parallel. In 2016–2020, short-range connectivity—largely Wi-Fi and Bluetooth—accounts for 40% of deployments, with public 2G–4G at 29%. In 2021–2025, short-range remains the single largest category but drops to 31%, while public 2G–4G rises to 33% and takes the lead. As deployments spread across wider geographies and more mobile or distributed assets, cellular becomes more central.
Figure 1: IoT deployments by connectivity
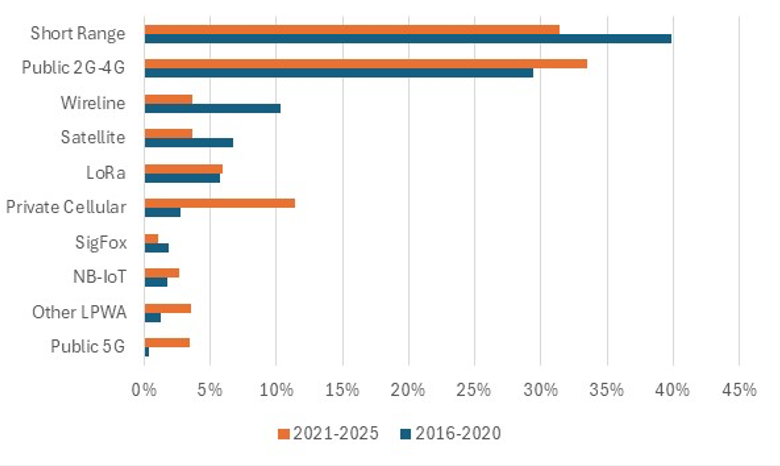
The standout change is private cellular, which jumps from 3% in 2016–2020 to 11% in 2021–2025—evidence that enterprises are increasingly willing to deploy controlled, on-site cellular networks when they need predictable performance, security, and local control. Public 5G becomes visible at 3% in 2021–2025, up from effectively zero in the prior period; however, the tracker suggests that for many IoT requirements, the market remains dominated by proven 4G-era connectivity rather than a wholesale shift to high-bandwidth, low-latency 5G use cases.
Taken together, the story of IoT in the 2020s is not simply “more deployments.” It is about where deployments are being concentrated—more often in government, utilities, smart cities, and the built environment—and what they are being designed to do—more often tied to automation, process integration, and operational control. Even acknowledging the limits of what can be tracked from public disclosures, the decade-long dataset identified a consistent trend: IoT is becoming less about connecting assets so they can be monitored, and more about connecting systems so organisations can run operations more effectively and reliably.